- التفاصيل
-
المجموعة: الاقتصاد الزراعي
-
نشر بتاريخ: 17 تشرين2/نوفمبر 2011
-
الزيارات: 15309
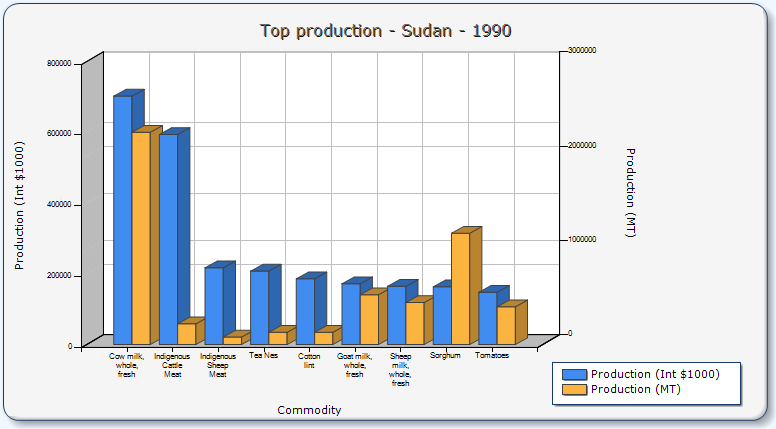
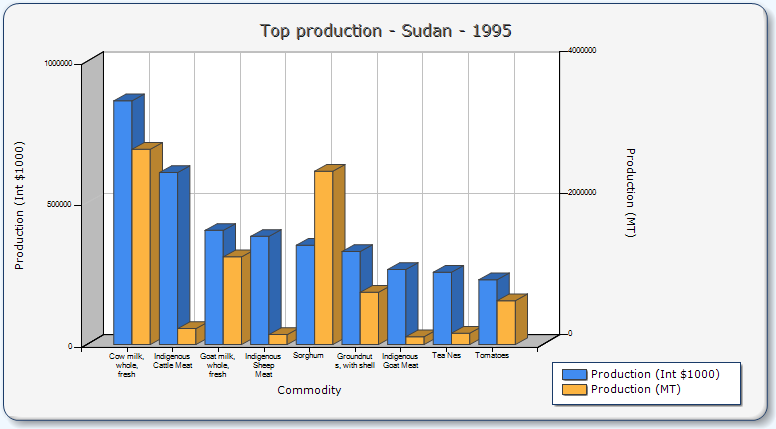
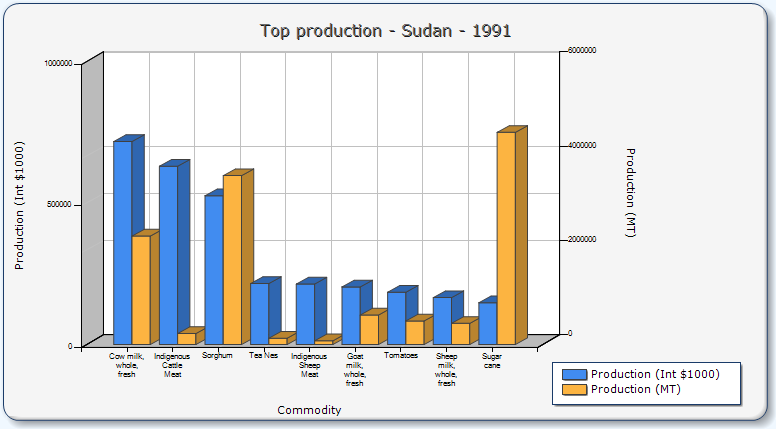
الانتاج السوداني لسلع مختلفة 1990 ــــ 2005
|
|
Rank
|
Commodity
|
Production (Int $1000)
|
Flag
|
Production (MT)
|
Flag
|
|
1
|
Cow milk, whole, fresh
|
702340
|
*
|
2250650
|
|
|
2
|
Indigenous Cattle Meat
|
593916
|
*
|
219857
|
Fc
|
|
3
|
Indigenous Sheep Meat
|
217013
|
*
|
79702
|
Fc
|
|
4
|
Tea Nes
|
207619
|
*
|
130000
|
F
|
|
5
|
Cotton lint
|
185797
|
*
|
130000
|
F
|
|
6
|
Goat milk, whole, fresh
|
171770
|
*
|
527691
|
|
|
7
|
Sheep milk, whole, fresh
|
164625
|
*
|
445000
|
F
|
|
8
|
Sorghum
|
163304
|
*
|
1180000
|
|
|
9
|
Tomatoes
|
147826
|
*
|
400000
|
F
|
|
10
|
Sugar cane
|
138638
|
*
|
4222000
|
|
|
11
|
Fruit Fresh Nes
|
104710
|
*
|
300000
|
F
|
|
12
|
Indigenous Goat Meat
|
83832
|
*
|
34987
|
Fc
|
|
13
|
Vegetables fresh nes
|
73492
|
*
|
390000
|
F
|
|
14
|
Mangoes, mangosteens, guavas
|
59917
|
*
|
100000
|
F
|
|
15
|
Dates
|
56177
|
*
|
110000
|
F
|
|
16
|
Wheat
|
55384
|
*
|
409000
|
|
|
17
|
Groundnuts, with shell
|
54456
|
*
|
123000
|
|
|
18
|
Sesame seed
|
52286
|
*
|
80000
|
|
|
19
|
Indigenous Camel Meat
|
50042
|
*
|
23878
|
Fc
|
|
20
|
Cottonseed
|
48286
|
*
|
152000
|
F
|
|
 |
|
|
Rank
|
Commodity
|
Production (Int $1000)
|
Flag
|
Production (MT)
|
Flag
|
|
1
|
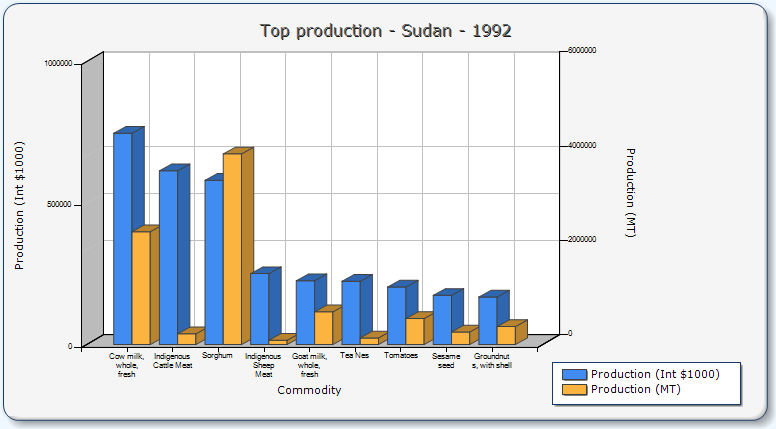
Cow milk, whole, fresh
|
717513
|
*
|
2299270
|
|
|
2
|
Indigenous Cattle Meat
|
630169
|
*
|
233277
|
Fc
|
|
3
|
Sorghum
|
525759
|
*
|
3581000
|
|
|
4
|
Tea Nes
|
215604
|
*
|
135000
|
F
|
|
5
|
Indigenous Sheep Meat
|
213679
|
*
|
78478
|
Fc
|
|
6
|
Goat milk, whole, fresh
|
203445
|
*
|
625000
|
F
|
|
7
|
Tomatoes
|
184782
|
*
|
500000
|
F
|
|
8
|
Sheep milk, whole, fresh
|
165735
|
*
|
448000
|
F
|
|
9
|
Sugar cane
|
147701
|
*
|
4498000
|
|
|
10
|
Fruit Fresh Nes
|
129841
|
*
|
372000
|
F
|
|
11
|
Cotton lint
|
125770
|
*
|
88000
|
F
|
|
12
|
Indigenous Goat Meat
|
124597
|
*
|
52000
|
Fc
|
|
13
|
Wheat
|
92968
|
*
|
686000
|
|
|
14
|
Vegetables fresh nes
|
79145
|
*
|
420000
|
F
|
|
15
|
Groundnuts, with shell
|
78746
|
*
|
180000
|
|
|
16
|
Mangoes, mangosteens, guavas
|
77892
|
*
|
130000
|
F
|
|
17
|
Dates
|
71499
|
*
|
140000
|
F
|
|
18
|
Sesame seed
|
63496
|
*
|
97000
|
|
|
19
|
Millet
|
52954
|
*
|
308000
|
|
|
20
|
Indigenous Camel Meat
|
48935
|
*
|
23349
|
Fc
|
|
|
* :
|
Unofficial figure
|
|
[ ]:
|
Official data
|
|
F :
|
FAO estimate
|
|
Fc:
|
Calculated data
|
|
|
Rank
|
Commodity
|
Production (Int $1000)
|
Flag
|
Production (MT)
|
Flag
|
|
1
|
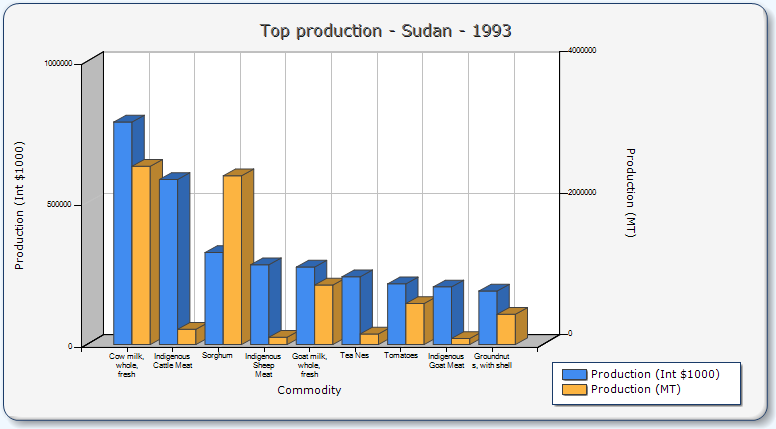
Cow milk, whole, fresh
|
746700
|
*
|
2392800
|
F
|
|
2
|
Indigenous Cattle Meat
|
613985
|
*
|
227286
|
Fc
|
|
3
|
Sorghum
|
580294
|
*
|
4042000
|
|
|
4
|
Indigenous Sheep Meat
|
250498
|
*
|
92000
|
Fc
|
|
5
|
Goat milk, whole, fresh
|
225580
|
*
|
693000
|
*
|
|
6
|
Tea Nes
|
223590
|
*
|
140000
|
F
|
|
7
|
Tomatoes
|
203260
|
*
|
550000
|
F
|
|
8
|
Sesame seed
|
173632
|
*
|
266000
|
|
|
9
|
Groundnuts, with shell
|
167914
|
*
|
380000
|
|
|
10
|
Sheep milk, whole, fresh
|
166474
|
*
|
450000
|
F
|
|
11
|
Indigenous Goat Meat
|
165330
|
*
|
69000
|
Fc
|
|
12
|
Sugar cane
|
146913
|
*
|
4474000
|
|
|
13
|
Fruit Fresh Nes
|
130888
|
*
|
375000
|
F
|
|
14
|
Wheat
|
117746
|
*
|
838000
|
|
|
15
|
Mangoes, mangosteens, guavas
|
80888
|
*
|
135000
|
F
|
|
16
|
Vegetables fresh nes
|
80087
|
*
|
425000
|
F
|
|
17
|
Cotton lint
|
80035
|
*
|
56000
|
F
|
|
18
|
Millet
|
78502
|
*
|
449000
|
|
|
19
|
Dates
|
72520
|
*
|
142000
|
F
|
|
20
|
Wool, greasy
|
51654
|
*
|
27000
|
F
|
|
|
* :
|
Unofficial figure
|
|
[ ]:
|
Official data
|
|
F :
|
FAO estimate
|
|
Fc:
|
Calculated
|
|
|
Rank
|
Commodity
|
Production (Int $1000)
|
Flag
|
Production (MT)
|
Flag
|
|
1
|
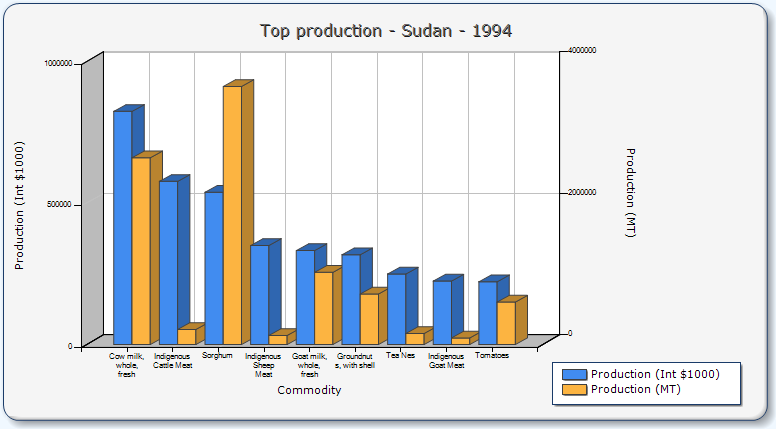
Cow milk, whole, fresh
|
786394
|
*
|
2520000
|
F
|
|
2
|
Indigenous Cattle Meat
|
583486
|
*
|
215996
|
Fc
|
|
3
|
Sorghum
|
325214
|
*
|
2386000
|
|
|
4
|
Indigenous Sheep Meat
|
282082
|
*
|
103600
|
Fc
|
|
5
|
Goat milk, whole, fresh
|
273756
|
*
|
841000
|
*
|
|
6
|
Tea Nes
|
239560
|
*
|
150000
|
*
|
|
7
|
Tomatoes
|
214347
|
*
|
580000
|
F
|
|
8
|
Indigenous Goat Meat
|
203667
|
*
|
85000
|
Fc
|
|
9
|
Groundnuts, with shell
|
189085
|
*
|
428000
|
|
|
10
|
Sugar cane
|
135485
|
*
|
4126000
|
|
|
11
|
Sheep milk, whole, fresh
|
135029
|
*
|
365000
|
*
|
|
12
|
Fruit Fresh Nes
|
122162
|
*
|
350000
|
F
|
|
13
|
Sesame seed
|
114400
|
*
|
175000
|
|
|
14
|
Mangoes, mangosteens, guavas
|
77892
|
*
|
130000
|
F
|
|
15
|
Vegetables fresh nes
|
75376
|
*
|
400000
|
F
|
|
16
|
Cotton lint
|
68602
|
*
|
48000
|
F
|
|
17
|
Dates
|
66392
|
*
|
130000
|
F
|
|
18
|
Wheat
|
61694
|
*
|
453000
|
|
|
19
|
Wool, greasy
|
61220
|
*
|
32000
|
F
|
|
20
|
Indigenous Camel Meat
|
50007
|
*
|
23861
|
Fc
|
|
|
* :
|
Unofficial figure
|
|
[ ]:
|
Official data
|
|
F :
|
FAO estimate
|
|
Fc:
|
Calculated data
|
|
|
Rank
|
Commodity
|
Production (Int $1000)
|
Flag
|
Production (MT)
|
Flag
|
|
1
|
Cow milk, whole, fresh
|
823841
|
*
|
2640000
|
F
|
|
2
|
Indigenous Cattle Meat
|
576517
|
*
|
213416
|
Fc
|
|
3
|
Sorghum
|
538196
|
*
|
3648000
|
|
|
4
|
Indigenous Sheep Meat
|
350043
|
*
|
128560
|
Fc
|
|
5
|
Goat milk, whole, fresh
|
332023
|
*
|
1020000
|
|
|
6
|
Groundnuts, with shell
|
317228
|
*
|
714000
|
|
|
7
|
Tea Nes
|
249143
|
*
|
156000
|
F
|
|
8
|
Indigenous Goat Meat
|
224206
|
*
|
93572
|
Fc
|
|
9
|
Tomatoes
|
221738
|
*
|
600000
|
F
|
|
10
|
Millet
|
170496
|
*
|
973000
|
|
|
11
|
Sheep milk, whole, fresh
|
162775
|
*
|
440000
|
|
|
12
|
Sugar cane
|
140608
|
*
|
4282000
|
|
|
13
|
Fruit Fresh Nes
|
130888
|
*
|
375000
|
F
|
|
14
|
Sesame seed
|
109652
|
*
|
170000
|
|
|
15
|
Vegetables fresh nes
|
81030
|
*
|
430000
|
F
|
|
16
|
Mangoes, mangosteens, guavas
|
80888
|
*
|
135000
|
*
|
|
17
|
Cotton lint
|
78606
|
*
|
55000
|
F
|
|
18
|
Dates
|
70477
|
*
|
138000
|
F
|
|
19
|
Wool, greasy
|
68872
|
*
|
36000
|
F
|
|
20
|
Wheat
|
64859
|
*
|
475000
|
|
|
|
* :
|
Unofficial figure
|
|
[ ]:
|
Official data
|
|
F :
|
FAO estimate
|
|
Fc:
|
Calculated data
|
|
|
Rank
|
Commodity
|
Production (Int $1000)
|
Flag
|
Production (MT)
|
Flag
|
|
1
|
Cow milk, whole, fresh
|
861288
|
*
|
2760000
|
F
|
|
2
|
Indigenous Cattle Meat
|
607799
|
*
|
224996
|
Fc
|
|
3
|
Goat milk, whole, fresh
|
403310
|
*
|
1239000
|
|
|
4
|
Indigenous Sheep Meat
|
382104
|
*
|
140335
|
Fc
|
|
5
|
Sorghum
|
351155
|
*
|
2450000
|
|
|
6
|
Groundnuts, with shell
|
328678
|
*
|
738000
|
|
|
7
|
Indigenous Goat Meat
|
265302
|
*
|
110723
|
Fc
|
|
8
|
Tea Nes
|
255531
|
*
|
160000
|
F
|
|
9
|
Tomatoes
|
229130
|
*
|
620000
|
F
|
|
10
|
Sesame seed
|
205860
|
*
|
313000
|
|
|
11
|
Sugar cane
|
153086
|
*
|
4662000
|
|
|
12
|
Sheep milk, whole, fresh
|
143538
|
*
|
388000
|
|
|
13
|
Fruit Fresh Nes
|
131237
|
*
|
376000
|
F
|
|
14
|
Cotton lint
|
121482
|
*
|
85000
|
F
|
|
15
|
Mangoes, mangosteens, guavas
|
89875
|
*
|
150000
|
F
|
|
16
|
Vegetables fresh nes
|
82914
|
*
|
440000
|
F
|
|
17
|
Dates
|
81713
|
*
|
160000
|
F
|
|
18
|
Wool, greasy
|
72698
|
*
|
38000
|
F
|
|
19
|
Millet
|
65746
|
*
|
385000
|
|
|
20
|
Wheat
|
59992
|
*
|
448000
|
|
|
|
Unofficial figure
|
|
Official data
|
|
FAO estimate
|
|
|
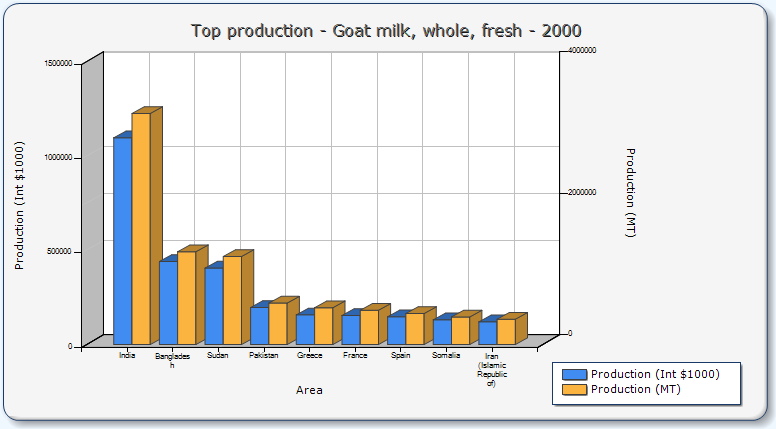
Rank
|
Area
|
Production (Int $1000)
|
Flag
|
Production (MT)
|
Flag
|
|
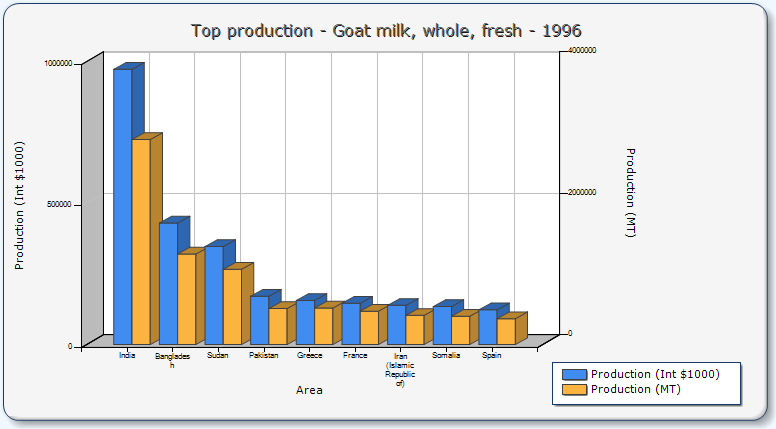
1
|
India
|
972510
|
*
|
2898000
|
|
|
2
|
Bangladesh
|
429542
|
*
|
1280000
|
Fc
|
|
3
|
Sudan
|
346345
|
*
|
1064000
|
|
|
4
|
Pakistan
|
170810
|
*
|
509000
|
|
|
5
|
Greece
|
155821
|
*
|
515927
|
|
|
6
|
France
|
145843
|
*
|
471600
|
|
|
7
|
Iran (Islamic Republic of)
|
138296
|
*
|
412112
|
|
|
8
|
Somalia
|
134232
|
*
|
400000
|
F
|
|
9
|
Spain
|
122654
|
*
|
365500
|
|
|
10
|
Russian Federation
|
99405
|
*
|
296221
|
|
|
11
|
Turkey
|
89078
|
*
|
265445
|
|
|
12
|
Indonesia
|
73827
|
*
|
220000
|
Fc
|
|
13
|
China
|
64606
|
*
|
201021
|
F
|
|
14
|
Jamaica
|
47820
|
*
|
142500
|
F
|
|
15
|
Algeria
|
47652
|
*
|
142000
|
|
|
16
|
Mali
|
45967
|
*
|
136979
|
Fc
|
|
17
|
Bulgaria
|
45073
|
*
|
143314
|
|
|
18
|
Niger
|
43625
|
*
|
130000
|
Fc
|
|
19
|
Mexico
|
41251
|
*
|
122925
|
|
|
20
|
Kenya
|
40605
|
*
|
121000
|
|
|
|
* :
|
Unofficial figure
|
|
[ ]:
|
Official data
|
|
F :
|
FAO estimate
|
|
Fc:
|
Calculated data
|
|
|
|
|
|
|
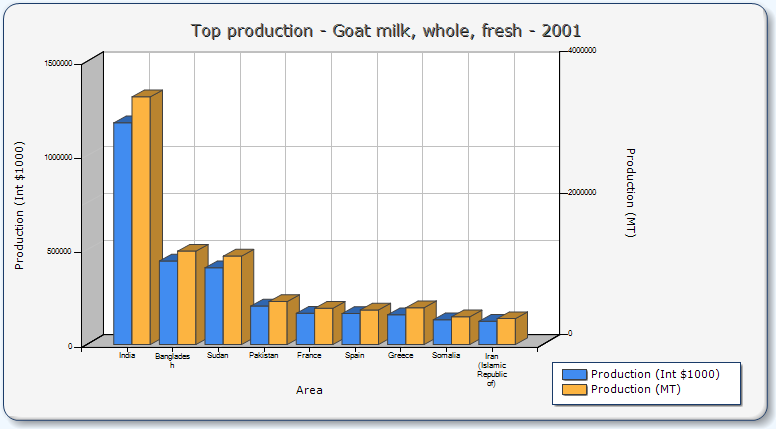
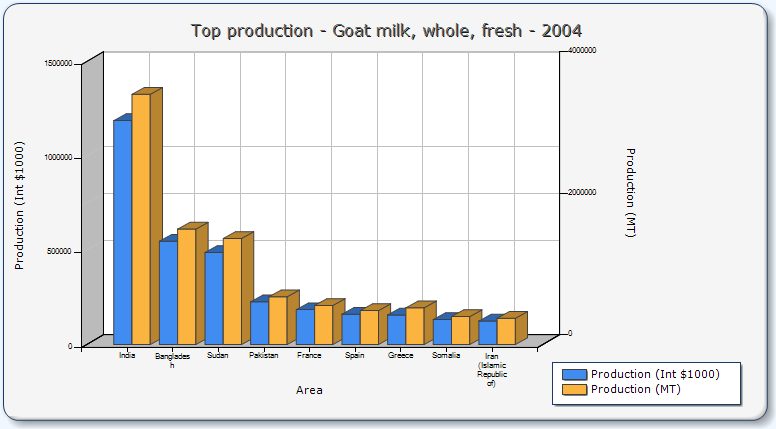
Rank
|
Area
|
Production (Int $1000)
|
Flag
|
Production (MT)
|
Flag
|
|
1
|
India
|
1020498
|
*
|
3041000
|
|
|
2
|
Bangladesh
|
445650
|
*
|
1328000
|
Fc
|
|
3
|
Sudan
|
333975
|
*
|
1026000
|
|
|
4
|
Pakistan
|
176850
|
*
|
527000
|
|
|
5
|
Greece
|
157885
|
*
|
522760
|
|
|
6
|
Somalia
|
137587
|
*
|
410000
|
F
|
|
7
|
Iran (Islamic Republic of)
|
132889
|
*
|
396000
|
|
|
8
|
France
|
131211
|
*
|
489000
|
|
|
9
|
Spain
|
127976
|
*
|
381703
|
|
|
10
|
Russian Federation
|
100567
|
*
|
299682
|
|
|
11
|
Turkey
|
83660
|
*
|
249302
|
|
|
12
|
Indonesia
|
76512
|
*
|
228000
|
Fc
|
|
13
|
China
|
68431
|
*
|
212920
|
F
|
|
14
|
Algeria
|
51914
|
*
|
154700
|
|
|
15
|
Bulgaria
|
51074
|
*
|
162197
|
|
|
16
|
Jamaica
|
48659
|
*
|
145000
|
F
|
|
17
|
Mali
|
46636
|
*
|
138973
|
Fc
|
|
18
|
Niger
|
45051
|
*
|
134250
|
Fc
|
|
19
|
Mexico
|
40446
|
*
|
120528
|
|
|
20
|
Kenya
|
40202
|
*
|
119800
|
|
|
|
* :
|
Unofficial figure
|
|
[ ]:
|
Official data
|
|
F :
|
FAO estimate
|
|
Fc:
|
Calculated data
|
|
|
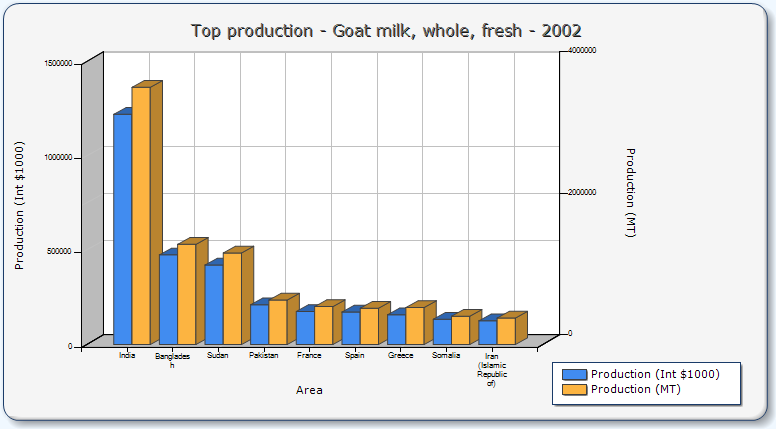
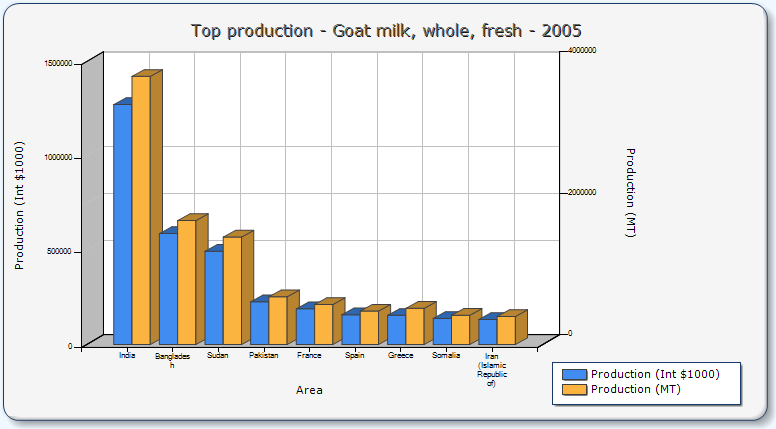
Rank
|
Area
|
Production (Int $1000)
|
Flag
|
Production (MT)
|
Flag
|
|
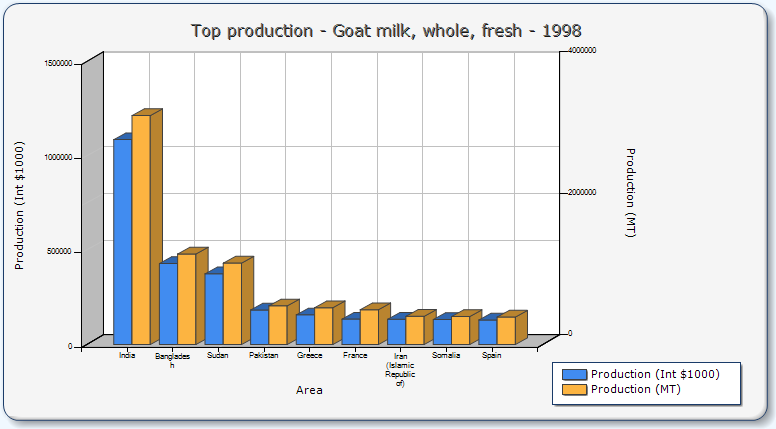
1
|
India
|
1085936
|
*
|
3236000
|
|
|
2
|
Bangladesh
|
429542
|
*
|
1280000
|
Fc
|
|
3
|
Sudan
|
374665
|
*
|
1151000
|
|
|
4
|
Pakistan
|
183226
|
*
|
546000
|
|
|
5
|
Greece
|
157163
|
*
|
520372
|
|
|
6
|
France
|
134601
|
*
|
492100
|
|
|
7
|
Iran (Islamic Republic of)
|
133560
|
*
|
398000
|
|
|
8
|
Somalia
|
132554
|
*
|
395000
|
F
|
|
9
|
Spain
|
130171
|
*
|
387900
|
|
|
10
|
Russian Federation
|
100488
|
*
|
299446
|
|
|
11
|
Turkey
|
82552
|
*
|
246000
|
|
|
12
|
Indonesia
|
72485
|
*
|
216000
|
Fc
|
|
13
|
China
|
70022
|
*
|
217912
|
F
|
|
14
|
Bulgaria
|
55605
|
*
|
190700
|
|
|
15
|
Algeria
|
53692
|
*
|
160000
|
|
|
16
|
Jamaica
|
50337
|
*
|
150000
|
F
|
|
17
|
Niger
|
47702
|
*
|
142150
|
Fc
|
|
18
|
Mali
|
47510
|
*
|
141576
|
Fc
|
|
19
|
Mexico
|
42868
|
*
|
127744
|
|
|
20
|
Kenya
|
41981
|
*
|
125100
|
|
|
|
* :
|
Unofficial figure
|
|
[ ]:
|
Official data
|
|
F :
|
FAO estimate
|
|
Fc:
|
Calculated data
|
|
|
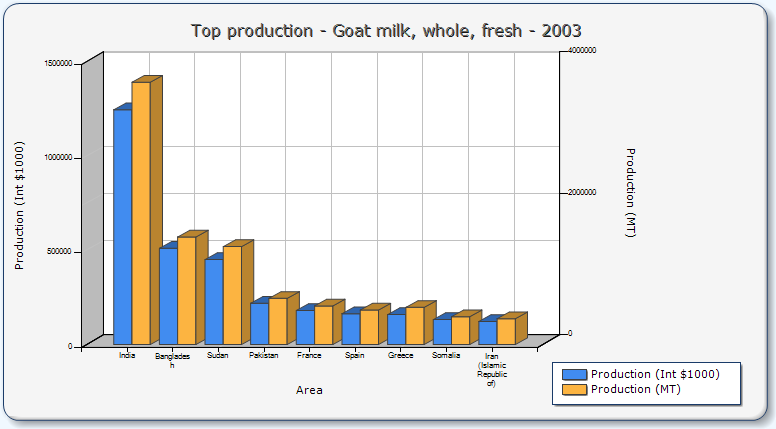
Rank
|
Area
|
Production (Int $1000)
|
Flag
|
Production (MT)
|
Flag
|
|
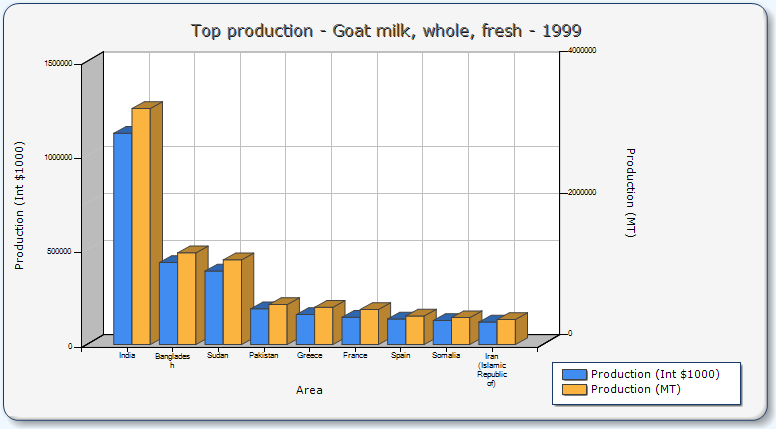
1
|
India
|
1119830
|
*
|
3337000
|
|
|
2
|
Bangladesh
|
434911
|
*
|
1296000
|
Fc
|
|
3
|
Sudan
|
389638
|
*
|
1197000
|
|
|
4
|
Pakistan
|
189602
|
*
|
565000
|
|
|
5
|
Greece
|
158906
|
*
|
526142
|
|
|
6
|
France
|
144567
|
*
|
495800
|
|
|
7
|
Spain
|
135607
|
*
|
404100
|
|
|
8
|
Somalia
|
127520
|
*
|
380000
|
F
|
|
9
|
Iran (Islamic Republic of)
|
118872
|
*
|
354230
|
|
|
10
|
Russian Federation
|
100331
|
*
|
298978
|
|
|
11
|
Turkey
|
79196
|
*
|
236000
|
|
|
12
|
China
|
71352
|
*
|
222125
|
F
|
|
13
|
Indonesia
|
68458
|
*
|
204000
|
Fc
|
|
14
|
Bulgaria
|
58055
|
*
|
200000
|
|
|
15
|
Jamaica
|
51175
|
*
|
152500
|
F
|
|
16
|
Niger
|
49967
|
*
|
148900
|
Fc
|
|
17
|
Mali
|
48605
|
*
|
144841
|
Fc
|
|
18
|
Algeria
|
47987
|
*
|
143000
|
|
|
19
|
Afghanistan
|
45303
|
*
|
135000
|
|
|
20
|
Mexico
|
43960
|
*
|
130998
|
|
|
|
* :
|
Unofficial figure
|
|
[ ]:
|
Official data
|
|
F :
|
FAO estimate
|
|
Fc:
|
Calculated data
|
|
|
Rank
|
Area
|
Production (Int $1000)
|
Flag
|
Production (MT)
|
Flag
|
|
1
|
India
|
1096004
|
*
|
3266000
|
|
|
2
|
Bangladesh
|
440280
|
*
|
1312000
|
Fc
|
|
3
|
Sudan
|
405263
|
*
|
1245000
|
|
|
4
|
Pakistan
|
196649
|
*
|
586000
|
|
|
5
|
Greece
|
157182
|
*
|
520433
|
|
|
6
|
France
|
154204
|
*
|
484517
|
|
|
7
|
Spain
|
147151
|
*
|
438541
|
|
|
8
|
Somalia
|
130876
|
*
|
390000
|
F
|
|
9
|
Iran (Islamic Republic of)
|
120130
|
*
|
357980
|
|
|
10
|
Russian Federation
|
106224
|
*
|
316541
|
|
|
11
|
Turkey
|
73898
|
*
|
220211
|
|
|
12
|
China
|
73829
|
*
|
230006
|
F
|
|
13
|
Indonesia
|
67116
|
*
|
200000
|
Fc
|
|
14
|
Bulgaria
|
53759
|
*
|
190200
|
|
|
15
|
Jamaica
|
52014
|
*
|
155000
|
F
|
|
16
|
Algeria
|
51343
|
*
|
153000
|
|
|
17
|
Niger
|
50706
|
*
|
151100
|
Fc
|
|
18
|
Mali
|
49944
|
*
|
148830
|
Fc
|
|
19
|
Brazil
|
49330
|
*
|
147000
|
Fc
|
|
20
|
Mexico
|
44020
|
*
|
131177
|
|
|
|
* :
|
Unofficial figure
|
|
[ ]:
|
Official data
|
|
F :
|
FAO estimate
|
|
Fc:
|
Calculated data
|
|
|
Rank
|
Area
|
Production (Int $1000)
|
Flag
|
Production (MT)
|
Flag
|
|
1
|
India
|
1174865
|
*
|
3501000
|
|
|
2
|
Bangladesh
|
442965
|
*
|
1320000
|
Fc
|
|
3
|
Sudan
|
406890
|
*
|
1250000
|
F
|
|
4
|
Pakistan
|
203697
|
*
|
607000
|
|
|
5
|
France
|
165306
|
*
|
511600
|
|
|
6
|
Spain
|
163997
|
*
|
488700
|
|
|
7
|
Greece
|
157393
|
*
|
521133
|
|
|
8
|
Somalia
|
131379
|
*
|
391500
|
F
|
|
9
|
Iran (Islamic Republic of)
|
122802
|
*
|
365940
|
|
|
10
|
Russian Federation
|
103604
|
*
|
308733
|
|
|
11
|
China
|
78691
|
*
|
245493
|
F
|
|
12
|
Turkey
|
73758
|
*
|
219795
|
|
|
13
|
Indonesia
|
65741
|
*
|
195904
|
Fc
|
|
14
|
Jamaica
|
52853
|
*
|
157500
|
F
|
|
15
|
Algeria
|
52014
|
*
|
155000
|
F
|
|
16
|
Mali
|
51550
|
*
|
153615
|
Fc
|
|
17
|
Niger
|
49045
|
*
|
146150
|
Fc
|
|
18
|
Mexico
|
46938
|
*
|
139873
|
|
|
19
|
Brazil
|
46310
|
*
|
138000
|
Fc
|
|
20
|
Mauritania
|
33977
|
*
|
101250
|
Fc
|
|
|
* :
|
Unofficial figure
|
|
[ ]:
|
Official data
|
|
F :
|
FAO estimate
|
|
Fc:
|
Calculated data
|
|
|
Rank
|
Area
|
Production (Int $1000)
|
Flag
|
Production (MT)
|
Flag
|
|
1
|
India
|
1220168
|
*
|
3636000
|
|
|
2
|
Bangladesh
|
475181
|
*
|
1416000
|
Fc
|
|
3
|
Sudan
|
421538
|
*
|
1295000
|
|
|
4
|
Pakistan
|
211079
|
*
|
629000
|
|
|
5
|
France
|
175541
|
*
|
536100
|
|
|
6
|
Spain
|
172186
|
*
|
513100
|
|
|
7
|
Greece
|
158033
|
*
|
523250
|
|
|
8
|
Somalia
|
134181
|
*
|
399850
|
Im
|
|
9
|
Iran (Islamic Republic of)
|
125557
|
*
|
374150
|
|
|
10
|
Russian Federation
|
98786
|
*
|
294376
|
|
|
11
|
China
|
82979
|
*
|
259073
|
F
|
|
12
|
Turkey
|
70344
|
*
|
209621
|
|
|
13
|
Indonesia
|
67116
|
*
|
200000
|
Fc
|
|
14
|
Niger
|
54280
|
*
|
161750
|
Fc
|
|
15
|
Jamaica
|
53692
|
*
|
160000
|
F
|
|
16
|
Mali
|
53454
|
*
|
159291
|
Fc
|
|
17
|
Algeria
|
51872
|
*
|
154575
|
Im
|
|
18
|
Mexico
|
49151
|
*
|
146468
|
|
|
19
|
Brazil
|
48374
|
*
|
144153
|
Fc
|
|
20
|
Afghanistan
|
41410
|
*
|
123400
|
|
|
|
* :
|
Unofficial figure
|
|
[ ]:
|
Official data
|
|
F :
|
FAO estimate
|
|
Fc:
|
Calculated data
|
|
Im:
|
FAO data based on imputation methodology
|
|
|
Rank
|
Area
|
Production (Int $1000)
|
Flag
|
Production (MT)
|
Flag
|
|
1
|
India
|
1244330
|
*
|
3708000
|
|
|
2
|
Bangladesh
|
510081
|
*
|
1520000
|
F
|
|
3
|
Sudan
|
450509
|
*
|
1384000
|
|
|
4
|
Pakistan
|
218798
|
*
|
652000
|
|
|
5
|
France
|
180592
|
*
|
545650
|
|
|
6
|
Spain
|
163360
|
*
|
486800
|
|
|
7
|
Greece
|
158555
|
*
|
524980
|
|
|
8
|
Somalia
|
132050
|
*
|
393500
|
F
|
|
9
|
Iran (Islamic Republic of)
|
122486
|
*
|
365000
|
F
|
|
10
|
Russian Federation
|
96332
|
*
|
287062
|
|
|
11
|
Turkey
|
93336
|
*
|
278136
|
|
|
12
|
China
|
85343
|
*
|
266567
|
F
|
|
13
|
Indonesia
|
68458
|
*
|
204000
|
Fc
|
|
14
|
Niger
|
57300
|
*
|
170750
|
Fc
|
|
15
|
Algeria
|
57048
|
*
|
170000
|
F
|
|
16
|
Mali
|
55692
|
*
|
165960
|
Fc
|
|
17
|
Mexico
|
50955
|
*
|
151842
|
|
|
18
|
Jamaica
|
47905
|
*
|
142755
|
Im
|
|
19
|
Brazil
|
45303
|
*
|
135000
|
Fc
|
|
20
|
Mauritania
|
37148
|
*
|
110700
|
Fc
|
|
|
* :
|
Unofficial figure
|
|
[ ]:
|
Official data
|
|
F :
|
FAO estimate
|
|
Fc:
|
Calculated data
|
|
Im:
|
FAO data based on imputation methodology
|
|
|
Rank
|
Area
|
Production (Int $1000)
|
Flag
|
Production (MT)
|
Flag
|
|
1
|
India
|
1186946
|
*
|
3537000
|
|
|
2
|
Bangladesh
|
547666
|
*
|
1632000
|
F
|
|
3
|
Sudan
|
488268
|
*
|
1500000
|
|
|
4
|
Pakistan
|
226516
|
*
|
675000
|
|
|
5
|
France
|
184994
|
*
|
552268
|
|
|
6
|
Spain
|
160877
|
*
|
479400
|
|
|
7
|
Greece
|
156857
|
*
|
519358
|
|
|
8
|
Somalia
|
132446
|
*
|
394680
|
F
|
|
9
|
Iran (Islamic Republic of)
|
124463
|
*
|
370890
|
|
|
10
|
Russian Federation
|
89994
|
*
|
268177
|
|
|
11
|
Turkey
|
86944
|
*
|
259087
|
|
|
12
|
China
|
80664
|
*
|
251873
|
F
|
|
13
|
Indonesia
|
68592
|
*
|
204400
|
Fc
|
|
14
|
Algeria
|
63995
|
*
|
190700
|
|
|
15
|
Niger
|
60404
|
*
|
180000
|
Fc
|
|
16
|
Mali
|
58308
|
*
|
173754
|
Fc
|
|
17
|
Jamaica
|
54531
|
*
|
162500
|
F
|
|
18
|
Mexico
|
54014
|
*
|
160960
|
|
|
19
|
Brazil
|
47108
|
*
|
140378
|
Fc
|
|
20
|
Bulgaria
|
41739
|
*
|
129381
|
|
|
|
* :
|
Unofficial figure
|
|
[ ]:
|
Official data
|
|
F :
|
FAO estimate
|
|
Fc:
|
Calculated data
|
|
|
Rank
|
Area
|
Production (Int $1000)
|
Flag
|
Production (MT)
|
Flag
|
|
1
|
India
|
1271848
|
*
|
3790000
|
|
|
2
|
Bangladesh
|
587936
|
*
|
1752000
|
F
|
|
3
|
Sudan
|
494453
|
*
|
1519000
|
|
|
4
|
Pakistan
|
226516
|
*
|
675000
|
|
|
5
|
France
|
189293
|
*
|
565078
|
|
|
6
|
Spain
|
158360
|
*
|
471900
|
|
|
7
|
Greece
|
154445
|
*
|
511373
|
|
|
8
|
Somalia
|
138460
|
*
|
412600
|
F
|
|
9
|
Iran (Islamic Republic of)
|
132889
|
*
|
396000
|
*
|
|
10
|
Turkey
|
85156
|
*
|
253759
|
|
|
11
|
Russian Federation
|
85133
|
*
|
253692
|
|
|
12
|
China
|
82044
|
*
|
256236
|
F
|
|
13
|
Indonesia
|
72002
|
*
|
214560
|
Fc
|
|
14
|
Niger
|
63760
|
*
|
190000
|
Fc
|
|
15
|
Algeria
|
61883
|
*
|
184409
|
*
|
|
16
|
Mali
|
61350
|
*
|
182820
|
Fc
|
|
17
|
Jamaica
|
55118
|
*
|
164247
|
|
|
17
|
Mexico
|
55118
|
*
|
164247
|
|
|
19
|
Brazil
|
48527
|
*
|
144607
|
Fc
|
|
20
|
Kenya
|
43289
|
*
|
129000
|
|
|
|
* :
|
Unofficial figure
|
|
[ ]:
|
Official data
|
|
F :
|
FAO estimate
|
|
Fc:
|
Calculated data
|